


Daily Trading Journal
June 24, 2025 – Day 01
Funding Activity
Today marked the initiation of our trading account. We purchased 49 USD worth of USDT on Crypto.com, with the transaction totaling $51.28 paid via a debit card ending in XXXX.
The USDT was then transferred to our RoboForex MT5 real account (26161525) for trading gold. This transfer utilized the Ethereum ERC20 network, incurring a $10 gas fee. Our final deposit into the trading account was $38.82.
Account Balance Summary
Reflecting today's initial deposit and trading activity.
Gold Market Overview & Trades
The gold market experienced a significant downturn heading into today's trading session. From yesterday's closing price of 3370, gold heavily fell overnight to the 3320 zone. This downward trend continued as the NY session opened 8:30 AM CT.
For our gold trades, we utilized a 0.01 lot size with a 1:2000 leverage, which kept the margin cost for each trade to less than $2.
Initial Attempts to Reverse Trend:
- Trade 1: Entered a long position at 3307.55 (stopped at 3305).
- Trade 2: Second attempt to reverse the trend began at 3301.85 (stopped at 3300).
Despite these initial setbacks, we made a third attempt to anticipate a reversal:
- Trade 3: At 8:40 AM CT, entered a long position at 3297.28, placing our stop loss at 3295. Although the price came very close to our stop loss, it did not hit. We successfully closed this trade at 3307.62 at 9:14:36 AM CT, securing a $10 profit as bears took a break after their significant move since yesterday.
Trend Following Trade:
- Trade 4: Entered a short position from 3308.06 and closed at 3303.35. This was a 117-second trade from 9:18:56 AM CT.
Intraday Gold Price Movements & Trades (Simplified)
This chart provides a simplified visual representation of the key price points and your trades throughout the day. It highlights the general direction of price and where your entries and exits occurred.
Legend:
- Gold Price Path
- Stop Loss Levels
- Price Points & Trades (Hover for details)
1-Hour Gold Chart Analysis (As of 10:10 AM CT)
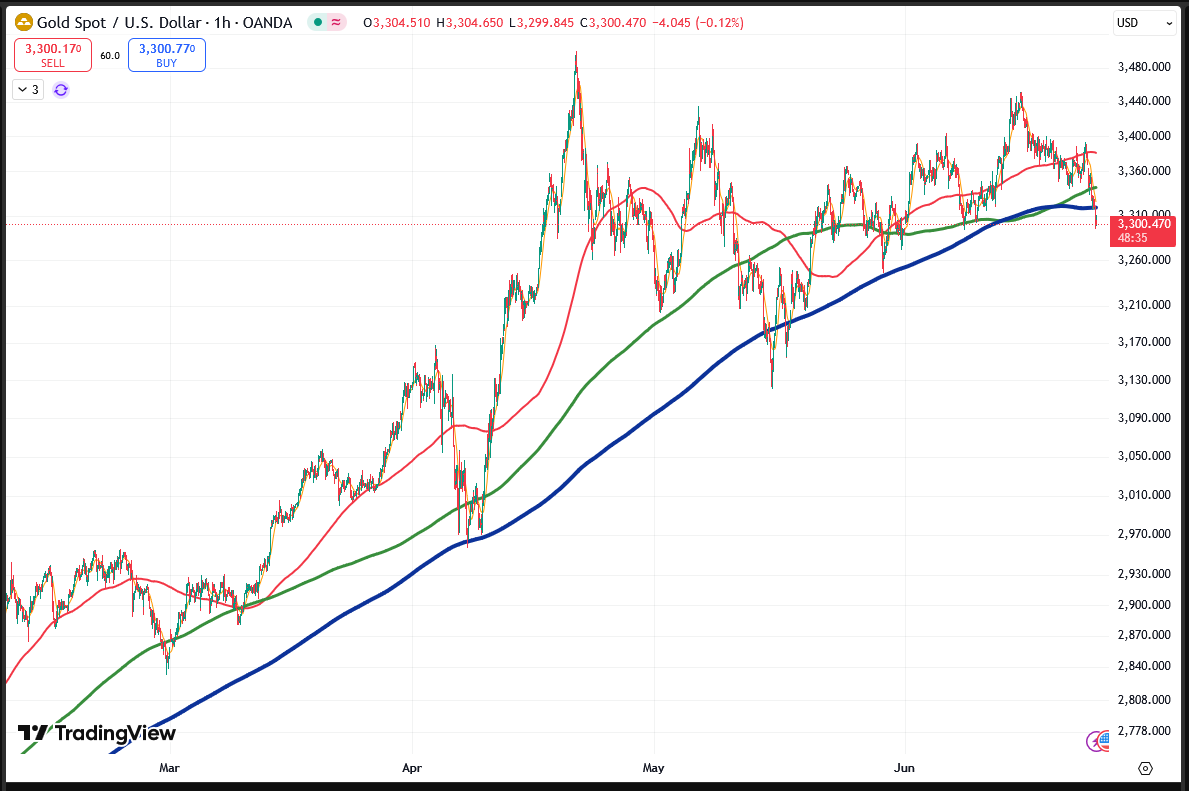
The 1-hour chart provides a detailed view of intraday price action, captured around 10:10 AM CT. Here's a breakdown of the moving averages and candle movements:
- The golden yellow line (MA14) shows price is actively trading below it, confirming strong immediate bearish momentum.
- The red line (MA200) indicates that price has broken significantly below this key intraday trend line, suggesting a shift to bearish control within the trading day.
- The green line (MA600) appears to have been broken to the downside, or is being tested as a new resistance level.
- The blue line (MA1000) is clearly broken, which is a major bearish signal on this short-term timeframe, implying deep and aggressive selling.
Recent candles are predominantly bearish, with strong downward momentum, indicating that sellers are in firm control of the market in the short term.
4-Hour Gold Chart Analysis (As of 9:50 AM CT)
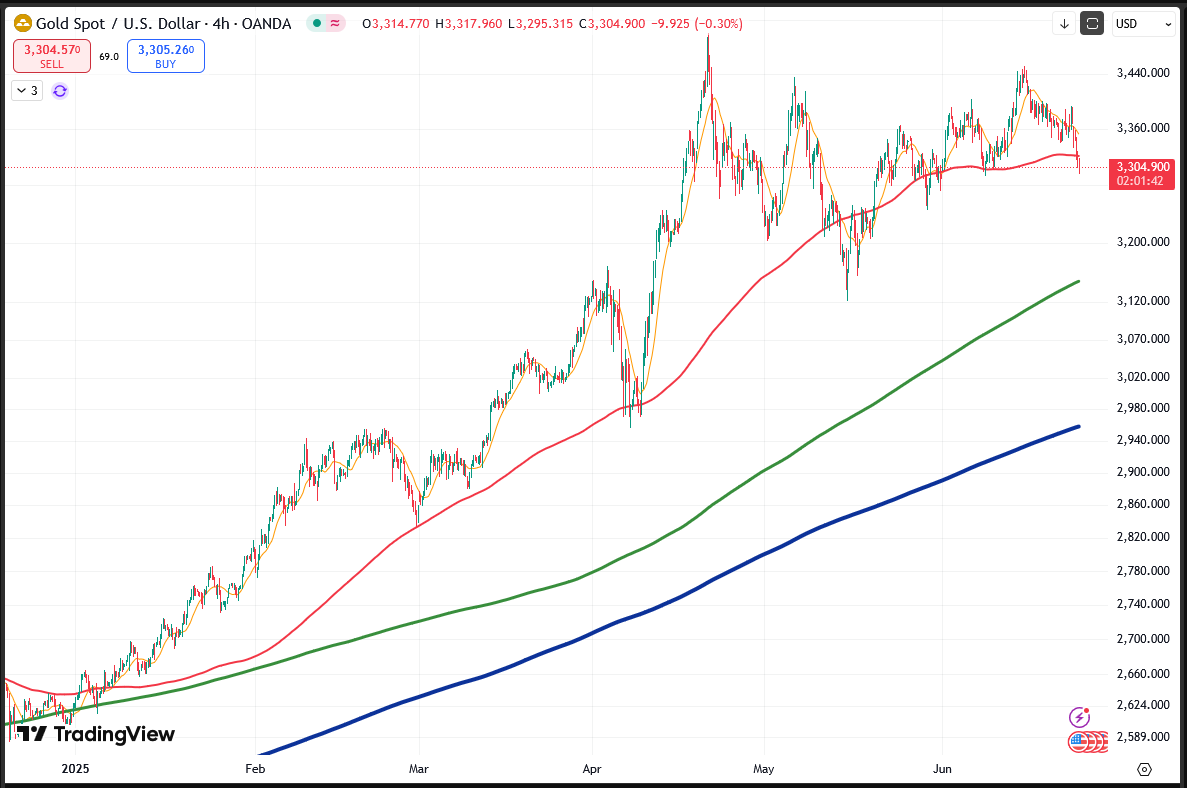
This 4-hour chart, observed around 9:50 AM CT, gives insight into Gold's mid-term trend:
- The golden yellow line (MA14) is clearly above the price, indicating that the recent strong bearish move has pushed price well below its short-term average.
- The red line (MA200) is being tested as a critical support level. A decisive break below this would signal a significant shift in the mid-term trend.
- The green line (MA600) and blue line (MA1000) are positioned much lower, highlighting strong long-term uptrend support that has not yet been threatened by this recent downturn.
The recent candles are large and bearish, showing considerable selling pressure. The current price action around the MA200 is crucial for determining the immediate future of the mid-term trend.
Daily Gold Chart Analysis (As of 10:12 AM CT)
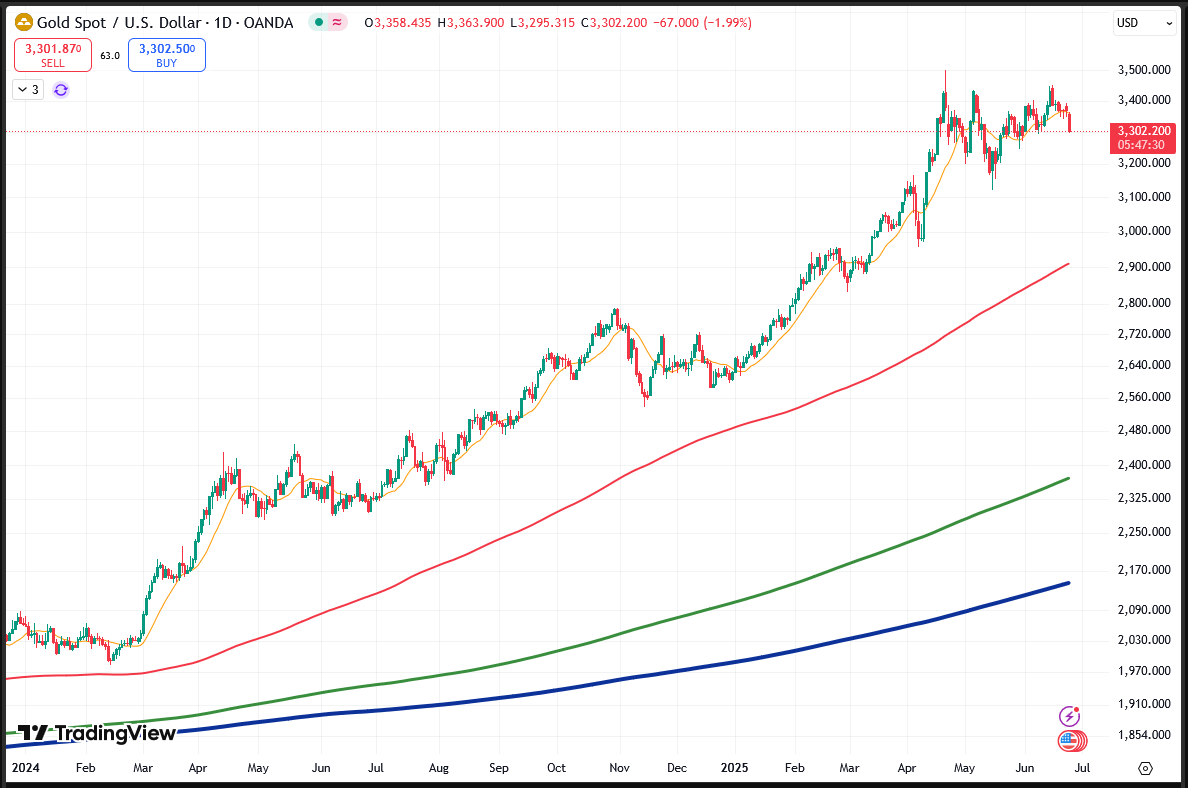
The Daily chart, captured around 10:12 AM CT, provides the overarching long-term trend perspective for Gold:
- The golden yellow line (MA14) has seen price break below it significantly, confirming short-term bearishness on the daily timeframe.
- The red line (MA200) remains well below the current price, acting as strong, distant support and indicating that the overall long-term daily trend is still bullish despite the recent pull-back.
- The green line (MA600) and blue line (MA1000) are even further below, reinforcing a very robust, sustained long-term uptrend for Gold over several months to years.
The most recent daily candle is a large bearish engulfing candle, reflecting the substantial price drop. However, as long as the price remains comfortably above the longer-term daily MAs (MA200, MA600, MA1000), this recent dip can be considered a correction within a broader bullish trend.
Current Market Outlook
As of now, we are observing the market closely. We anticipate further downward movement in gold to align with the broader daily and weekly chart trends.
However, we are also mindful of potential support levels, notably the 1000 MA nearby and 200 MA on 4-hour chart (as discussed in the analysis above), which could trigger an upward reversal at any moment. Our current prediction leans towards continued decline, but we remain vigilant for any signs of a market shift.